


Haemodynamic monitoring
Shock
The aim of monitoring haemodynamics is to avoid tissue hypoperfusion which leads to Multi Organ Dysfunction Syndrome (MODS).
Tissue hypoperfusion results from global, regional and microcirculatory failure.
Haemodynamic monitoring can assess each of these.
Early monitoring and prompt action has been shown to reduce mortality in septic shock. (Early goal directed therapy)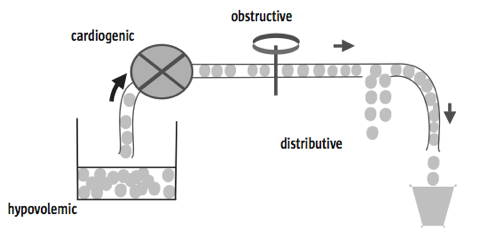
ESICM
Haemodynamic monitoring helps decide which type of shock present so appropriate treatment can be given.
DO2 = CaO2 x CO
CO = SV x HR
MAP = CO x SVR
DO2 = Oxygen delivery
CaO2 = Oxygen content of arterial blood
CO = Cardiac Output
SV = Stroke Volume
SVR = Systemic Vascular Resistance
Assessment
Clinical
Laboratory and basic
Monitoring devices
- Non invasive, minimally invasive, invasive
- Preload, contractility, afterload, lung water, global perfusion
- Tissue perfusion
Clinical
Important but neither particularly sensitive nor specific.
Basic monitoring
ECG, SpO2, ABP, lactate, U&Es
Arterial waveform
Peak pressure and pulse pressure increase as go distally down the arterial tree and the dicrotic notch moves lower (less compliance).
SV is derived from the area under the systolic part of the waveform.
Contractility from dP/dt (change in pressure / change in time - steepness of upward slope).
Vasoconstriction - shallow downward slope.
Vasodilatation - steep downward slope.
Hypovolaemia - low dicrotic notch, narrow waveform, respiratory variation.
Lactate
A good marker of tissue hypoperfusion in the absence of liver disease.
More on lactate.
ScvO2
Shows the balance between global O2 supply and demand.
Fick
CO = VO2 / CaO2 - CvO2
So
CvO2 = CaO2 - VO2/CO
Simplifying
SvO2 = SaO2 - VO2 / CO
As SaO2 is usually near max and does not change rapidly
SvO2 ∼ VO2 / CO
Will go down if supply is reduced or demand is increased.
Surrogate marker of CO. But will fall if hypoxia, anaemia, increased metabolic rate.
Normally ScvO2 is lower than SvO2 as splancnic extraction is low (meaning IVC SvO2 is high). In critical illness, blood is diverted from the splancnic circulation while demand may be increased both of which lower IVC SvO2. Therefore ScvO2 is higher than SvO2 in critical illness.
If CO is adequate, ScvO2 should be >70% in critically ill patients; SvO2 >65%.
ScvO2 vs SvO2 attracts some controversy. The 2 show reasonable correlation and the trend is useful.
Low SvO2 does not necessarily mean fluid, blood or dobutamine is needed:
People with chronic heart failure or anaemia will have low SvO2s without tissue hypoperfusion. They will not have much reserve however.
Exercise reduces SvO2 (most of the increased demand met by increased supply but extraction also increases).
Use common sense with SvO2 values. A low value may mean resus is needed but this may not be the best thing for the patient (eg fluid overload and myocardial strain).
A normal lactate is reassuring if SvO2 is low as it suggests CO is adequate for tissue perfusion.
Non invasive CO monitoring
ECHO
Longitudinal function (MAPSE), EF, dP/dT and Tei index measure contractility.
Measurement of diameter and velocity profile of blood in same area (usually LVOT) means SV can be calculated.
Vol = area x length
or
Vol = area x velocity x time (as distance = s x t)
Area under speed / time graph is distance
So area of under doppler graph = stroke distance = velocity x time = VTI (velocity time integral)
Flow volume (SV) = SD (VTI) x CSA
CSA = π r2
or
CSA = 0.785 x (diameter)2
ECHO is the monitor of choice in hypotension of unknown aetiology as it provides so much more information than other CO monitors (hypovolaemia, contractility, dilatation, all cardiac chambers, valve disease, tamponade, aortic dissection) and rapidly excludes a cardiac cause of shock. Valuable information for weaning failure too (diastolic function, severe regurg, v.poor LV). Drawbacks are that monitoring is not continuous, requires training and LVOT measurement prone to error.
For more detailed info see the echocardiography section.
Minimally invasive CO monitoring
- Pulse contour analysis (PiCCO, PULSECO/LiDCO, Vigileo/Flotrac)
- Oesophageal Doppler
- Fick principle (NICO)
Initial CO value estimated based on waveform, age and sex.
Then calibrated by transpulmonary thermodilution with cold saline (PiCCO) or lithium (LiDCO).
Vigileo not calibrated by thermodilution (‘calibrates’ by complicated analysis of changes in waveform to derive arterial compliance and SV)
Oesophageal doppler
Uses doppler in the tip of an oesophageal probe to measure the velocity profile of the red cells in the descending aorta (about 70% of total SV). Flow then calculated from assumption of the cross sectional area of the descending aorta (as above for echo).
Area of doppler signal is VTI or stroke distance.
Flow time is the ejection time. Dependent on HR so displayed as FTc.
Peak velocity
Mean acceleration time (AcT). Time from start of flow to peak velocity.
PV and AcT measures of contractility
Problems
FTc is afterload dependent and therefore not a measure of preload as commonly thought.
Cross sectional area of aorta assumed (are probes now that can measure it).
The oesophagus and aorta are assumed to be parallel. Most probes use an angle of 45° for the doppler signal. Because of the doppler equation, if the aorta is unfolded with a 15° angle between the oesophagus and aortic flow, the velocity may be underestimated by 20% or overestimated by 40% depending on the direction of the aorta. Angulation of the aorta is common.
The aortic cross-sectional area (CSA) is assumed to be circular.
The diameter of the descending aorta is not constant during extremes of blood pressure (unlike the aortic root). CSA may decrease up to 31% of normotensive values during extreme hypotension in patients with known atherosclerotic disease. In healthy sheep this relationship continues with hypertension causing an increase in CSA.
Flow is assumed to be laminar. Patients with atherosclerotic disease frequently demonstrate turbulent aortic flow. Turbulent flow renders the algorithms used to generate haemodynamic data inaccurate. Even trends may be incorrect.
Fick
CO = VO2 / AV O2 content difference
NICO
Uses CO2 uptake and AV difference to calculate CO. Inaccurate with increased dead space.
PiCCO
Various intrathoracic compartments between site of injection and temp measurement comprising blood (right heart, lungs, left heart) and water (lungs). Total of the compartments is termed intrathoracic thermal volume (ITTV). The lung compartment volume is termed pulmonary thermal volume (PTV).
Global end diastolic volume (GEDV) = ITTV - PTV (heart = total thoracic - lung)
Intrathoracic thermal blood volume (ITBV) = 1.25 x GEDV
Pulmonary blood volume (PBV) = ITBV - GEDV
Extravascular lung water (EVLW) = ITTV - ITBV
EVLW is a measure of pulmonary oedema.
Ratio of EVLW and PBV termed pulmonary vascular permeability index (PVPI) and reflects the permeability of the alveolar capillary membrane.
If the tip of the femoral catheter is below the diaphragm, part of the extrathoracic aortic blood volume will be included giving a falsely high measurement of ITBV and low of EVLW.
There are a lot of calculations, and assumptions within these, in the derived parameters rather than actual measurements with lots of potential for error.
GEDV is claimed to be more useful than CVP for fluid responsiveness (which is not saying much as CVP is useless). But preload is not pressure or volume and static methods such as this are pretty useless (see below).
Invasive CO monitoring
CVP
Measures RA pressure.
This is not preload.
The right heart is very compliant and is able to adapt its stroke volume to a large range of venous return without affecting the value of the CVP. There will come a point however where the right ventricle will no longer be able to adapt and CVP will rise. It has been proposed that this phenomenon can be used to guide volume replacement with a sustained rise in the CVP by 3 equating to the upper flat portion of the starling curve. More info.
See preload assessment below.
Pulmonary Artery Catheter (PAC)
Measures pressures (RA, RV, PA), SvO2 and SV (by thermodilution). When the PA is occluded a continuous column of blood is present between PA and LA meaning LA pressure is assumed to be measured (but not if pulmonary hypertension). This will be the same as LVEDP assuming no MV disease.
Can be useful for diagnosing severe MR (from shape of waveform - giant v waves), pulmonary hypertension (high pressures), RV failure (high right sided pressures and low PAOP), and high and low output failure.
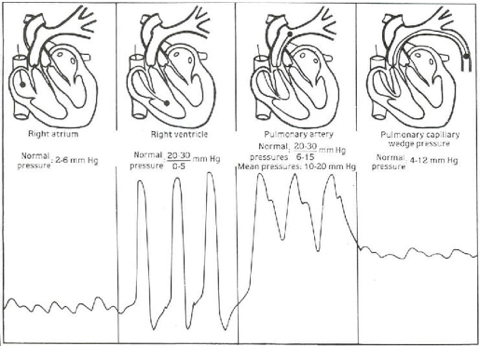
PAOP should be 5-12mmHg. Has to be >20 for cardiogenic pulmonary oedema to develop.
Oedema with PAOP <18 suggests increased pulmonary permeability (ARDS).
Measurements must be done at end expiration when pleural pressure at or close to zero. In IPPV pressures at their lowest at end expiration.
Only true measure of SvO2 (SVC, IVC and coronary sinus).
Tip should be positioned in west zone 3 where PA pressures are higher than alveolar pressures.
On CXR tip should be at the hilum (not beyond it) and below the LA (ensures in West zone 3).
About 50% of PEEP will be transmitted unless lung compliance is low as with ARDS in which case less PEEP will be transmitted.
Problems
There are a number of problems in obtaining accurate data from a PAC. Besides this a number of studies have highlighted the inability of clinicians to correctly interpret the data from PACs. PACs are now used with less and less frequency in the UK with resulting implications for training in their use.
PAOP:
Preload is end diastolic wall stress and not end diastolic pressure or end diastolic volume. Studies have conclusively shown that PAOP is unrelated to fluid responsiveness.
Cardiac Output:
Cardiac output data depends on the phase of the respiratory cycle during which the injectate is given as positive pressure ventilation produces variations in ventricular stroke volume.
Tricuspid regurgitation is significant in around half of critically ill ventilated patients. This will mean cardiac output is underestimated and therefore inaccurate.
Derived data (such as SVR):
Derived data are calculated by combinations of measured variables, all of which may have their own error. Thus errors are multiplied.
Impedence, and not resistance, is mathematically correct for the cardiovascular system as oscillatory flow is occurring, but is practically difficult to measure, so resistance is used as a surrogate for the opposition to flow.
SVR and afterload are not the same. Noradrenaline has been shown to increase SVR while reducing afterload.
The normal range of SVR is derived from normal patients. Haematocrit, plasma protein concentration and temperature all affect blood rheology and therefore SVR readings.
Stroke work index (MAP x SVI) is inaccurate with a ventricle with reduced inotropy and compliance.
Evidence:
Improved outcome:
Studies have consistently failed to show an improvement in outcome with the use of the PAC. These include large prospective randomised controlled trials, meta-analyses and a Cochrane review.
There is some weak evidence that more severely ill patients may benefit from a PAC (observational cohort study and retrospective analysis).
Harm:
Observational studies suggested increased harm with PACs but these have been refuted by subsequent prospective randomised controlled trials.
More on pulmonary artery catheters.
Thermodilution
Cold saline injected (into RV in PAC and CVC in PiCCO). Thermistor (in PAC tip or PiCCO A line) measures baseline temp before injection and plots temp against time graph. Analysis of this curve calculates CO.
Tissue perfusion (microcirculation)
Orthogonal polarisation spectroscopy (OPS) and sidestream dark-field imaging (SDF) allow bedside monitoring. Still research tools.
SvO2 and lactate are also markers of tissue perfusion.
Preload measurement
Traditionally measured with
CVP (RA pressure)
PAOP (LA pressure)
ECHO (LVED volume)
GEDV and ITBV (calculated by transpulmonary thermodilution by PiCCO)
Preload is end diastolic wall tension. Not volume or pressure.
Preload is determined by venous return which is in turn determined by mean circulatory filling pressure (MCFP - the pressure that would be present in the vasculature if cardiac output ceased) minus the CVP.
VR = MCFP - CVP / venous resistance
MCFP is regulated by the sympathetic nervous system’s effect on the splancnic venous system.
The splancnic venous system contains 20% of total blood volume, is 30 times more compliant than the arterial circulation and is heavily innervated with ɑ receptors.
It is essentially a reservoir of blood made up of capacitance vessels easily able to change in volume to maintain venous return to the heart.
A useful analogy is a tank of water with an outlet 1/2 way up the tank. The fluid below the outlet is unstressed venous volume (not contributing to flow out of the tank) and the fluid above is stressed volume.
Stressed volume determines MCFP.
Stressed volume can be increased by giving fluid (as long as the size of the tank does not increase from reflex venodilatation) or lowering the outlet (giving a venopressor to convert unstressed to stressed volume).
Traditionally, static markers to predict fluid responsiveness such as CVP and PAWP and estimation (PAC, PICCO) and measurement (ECHO) of ventricular volumes have been used - indeed the surviving sepsis guidelines advocate the use of CVP to predict fluid responsiveness.
But, preload is end diastolic wall stress and not end diastolic pressure or end diastolic volume.
Ventricular wall stress can be estimated using Laplace’s law, modified for thick walled structures. This is expressed as Lamé's equation:
σ ∝ (P1 - P2) x R / w
σ = wall stress; P1 = intraventricular pressure; P2 = extraventricular pressure; R = ventricular radius; w = wall thickness.
This is clearly impractical to use in clinical practice and has no evidence base that I know of.
The relationship between preload and stroke volume also depends on ventricular contractility and relaxation which are often impaired in critically ill patients.
If LV compliance is reduced (diastolic dysfunction) then the LVED PV relationship is shifted up and left meaning:
- LV can be under filled despite high filling pressures.
- Optimum filling range narrow (under or over filled easily)
- Therefore a hypovolaemic LV with diastolic dysfunction will have elevated filling pressures, may respond well to fluid, but will easily be overloaded with pulmonary oedema resulting.
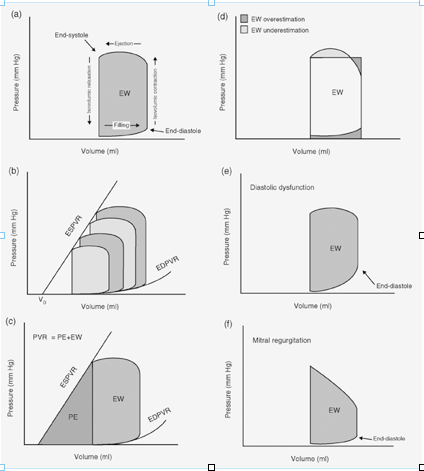
Note that the end systolic pressure volume relationship is a load independent measure of contractility.
Hence, even in theory, the static markers mentioned (CVP, PAOP, GEDV, EDV) should have little correlation with stroke volume or fluid responsiveness.
There is a huge amount of evidence since the 1970’s which has clearly and repeated demonstrated that static ‘preload’ markers are of no use in predicting fluid responsiveness.
A recent study by Osman et al. confirmed cardiac filling pressures (CVP and PAOP) are unable to predict fluid responsiveness. They had positive and negative predictive values of 54% and 63%.
In other words you might as well use a coin toss as look at CVP or PAOP values.
More recently, a number of dynamic indices have been shown to predict fluid responsiveness with very high sensitivity and specificity.
These include SPV, PPV, SVV, preejection period and vena cava diameter.
It is important to remember they are rendered inaccurate by RV overload, arrhythmias, spontaneous breathing and a tidal volume of <8mls/kg.
Passive leg raising (PLR) overcomes these difficulties.
It effectively provides a fluid challenge of around 300 mls to the central circulation which has the advantage of being completely reversible.
It has been shown to be even more accurate than PPV having a sensitivity and specificity of well over 90%.
See fluid challenge.
References
ESICM PACT module ‘haemodynamic monitoring’
Perel A. Assessing fluid responsiveness in mechanically ventilated patients. 25 Years of Progress and Innovation in Intensive Care Medicine. 2007:295-300
Wigfull, J. et al. Contin Educ Anaesth Crit Care Pain 2005 5:84-88
Simon Gelman. Venous Function and Central Venous Pressure - A Physiologic Story. Anesthesiology 2008; 108:735– 48
Lang R, Borow K, Neumann A, Janzen D. Systemic vascular resistance: an unreliable index of left ventricular afterload. Circulation 1986; 74: 1114–23
Osman D, Ridel C, Ray P et al. Cardiac filling pressures are not appropriate to predict haemodynamic response to volume challenge, Crit Care Med. 2007;35(1):64-8.